Description
Reduce noise and find root causes faster.
• Prometheus rules for RED/USE patterns and SLO error‑budget burn.
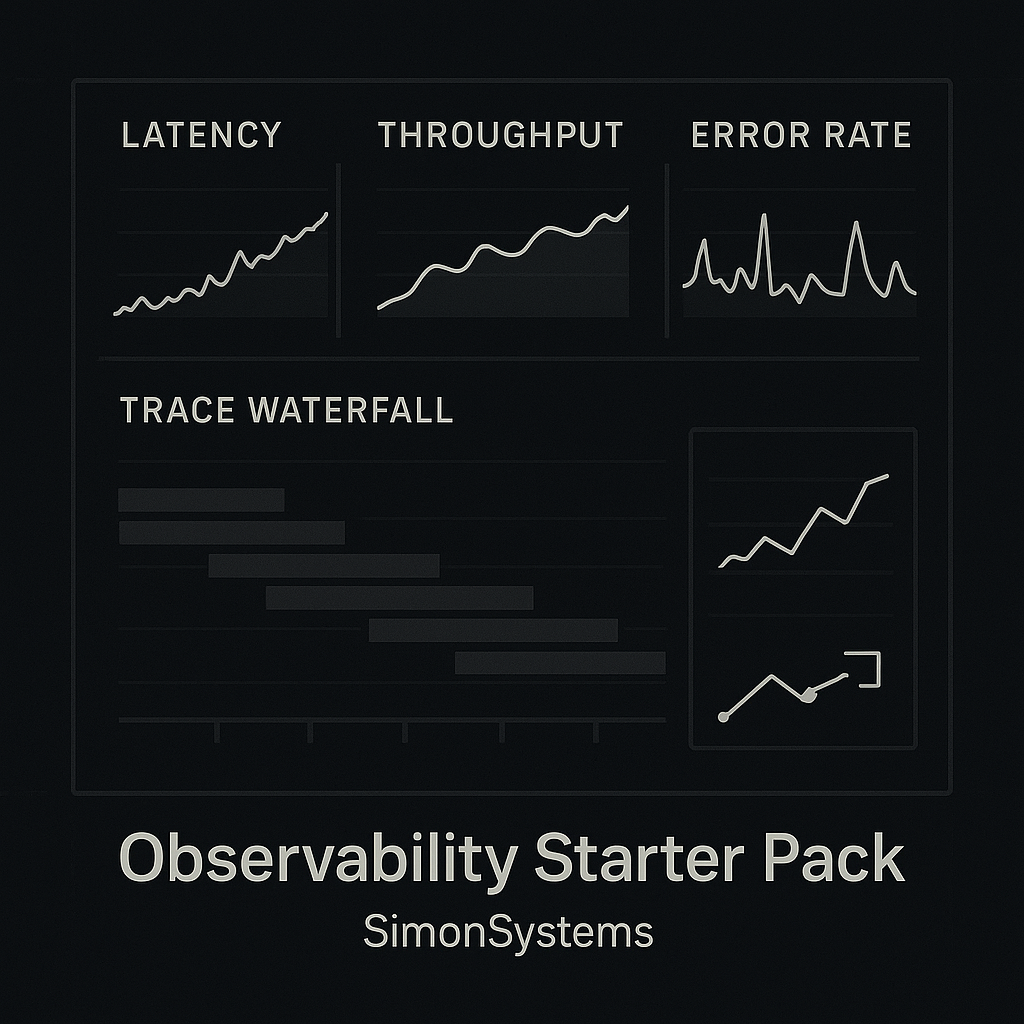
• Grafana JSON dashboards for latency/throughput/error rate + runtimes.
• OpenTelemetry Collector with tail‑based sampling.
• Log pipelines (Loki/ELK) with semantic fields and trace correlation.
• Runbooks (PDF), alert tuning guide, synthetic smoke job.
Install in ~20 minutes; multi‑tenancy labels and cardinality guardrails included.
Reviews
There are no reviews yet.